
In one afternoon on 17 Oct 2026, three Market Compass maps narrowed 27 indices to a short watchlist: IT and large private banks led, the capex and capital-markets complex was fading, and consumption was the next rotation candidate. This document shows how, step by step, using the live weekly data from 5 Dec 2025 to 16 Oct 2026. It is an educational case study, not a recommendation.
How to read a Market Compass map
Each index is plotted against a benchmark (here, Nifty 500) on two scores, where 100 means "in line with the benchmark".
- Strength (x-axis): is the index beating the benchmark over the lookback? Above 100 = outperforming.
- Momentum (y-axis): is that relative performance accelerating? Above 100 = improving.
The two scores split the map into four quadrants, and indices typically travel through them clockwise:
| Quadrant | Strength | Momentum | What it usually means |
|---|---|---|---|
| Improving | below 100 | above 100 | Still behind the benchmark, but catching up. Early-stage candidates. |
| Leading | above 100 | above 100 | Beating the benchmark and accelerating. The current leaders. |
| Weakening | above 100 | below 100 | Still ahead, but losing pace. Leaders that are tiring. |
| Lagging | below 100 | below 100 | Behind and slowing. Avoid until momentum turns. |
The trail behind each dot shows its last few weeks. Its direction matters more than its position: a dot in Lagging that is curling up toward Improving is a better candidate than one in Leading that is rolling down toward Weakening.
Kevala runs the same engine on three universes: sectors (10 indices), factors / strategy indices (7) and themes (10). Reading all three together is the core of the method.
Steps 1 to 3: read the three maps
All three maps use weekly data from 5 Dec 2025 to 16 Oct 2026, benchmarked to Nifty 500. The question at each step is the same: who is leading now, who is tiring, and who is turning up next?
Step 1: Sectors (10 indices)
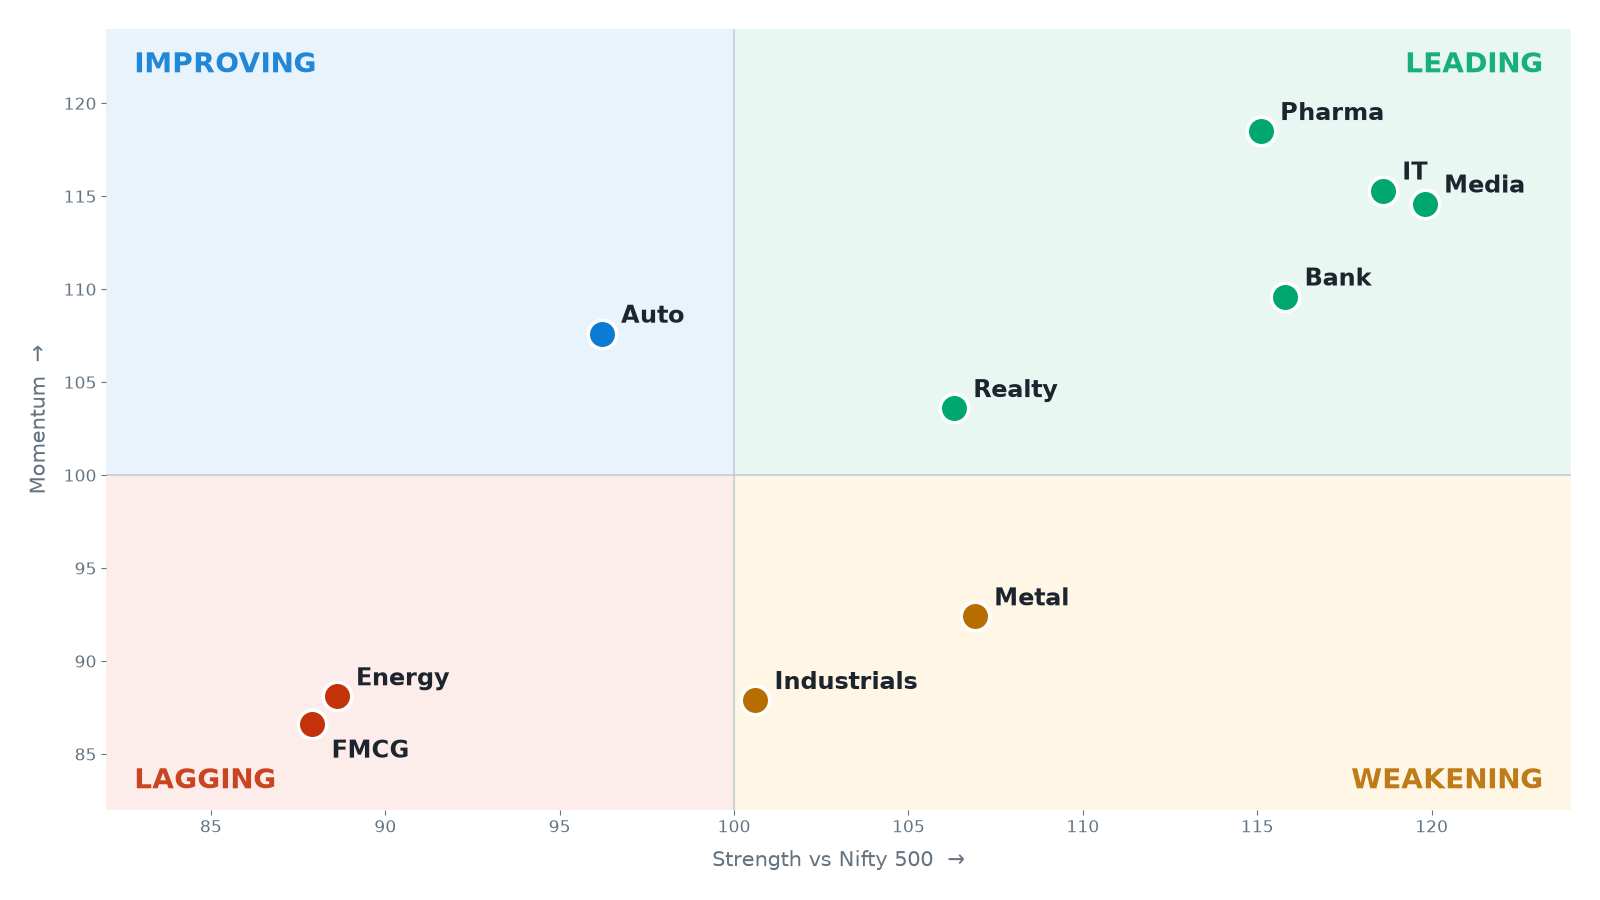
Over the year, leadership passed from cyclicals to financials, IT and pharma. On 16 Oct the map showed 5 Leading, 2 Weakening, 1 Improving and 2 Lagging.
| Sector | Strength / Momentum | Quadrant | One-line read |
|---|---|---|---|
| Media | 119.8 / 114.6 | Leading | Climbed from the weakest sector to the strongest; most extended |
| IT | 118.6 / 115.3 | Leading | Deep lag in April (87/80), fresh earnings-led recovery |
| Bank | 115.8 / 109.6 | Leading | Dipped below the benchmark in April, back on top |
| Pharma | 115.1 / 118.5 | Leading | Most consistent leader, about six months in the quadrant |
| Realty | 106.3 / 103.6 | Leading | Peaked in August; first leader likely to roll over |
| Metal | 106.9 / 92.4 | Weakening | Bounce inside a fading trend |
| Industrials | 100.6 / 87.9 | Weakening | Peaked in April; close to tipping into Lagging |
| Auto | 96.2 / 107.6 | Improving | Momentum turning up; next candidate to lead |
| Energy | 88.6 / 88.1 | Lagging | Gave back its April surge |
| FMCG | 87.9 / 86.6 | Lagging | Lagging all year |
Step 2: Factors (7 strategy indices)
The factor map shows what kind of stock is working. In April all seven factor indices were Leading at once, meaning the cap-weighted benchmark was the laggard. By 16 Oct leadership had narrowed to high-beta momentum: 2 Leading, 1 Weakening, 4 Lagging.
| Factor index | Strength / Momentum | Quadrant | One-line read |
|---|---|---|---|
| Nifty Alpha 50 | 114.5 / 122.4 | Leading | Strongest momentum on the map |
| Nifty500 Momentum 50 | 114.6 / 110.5 | Leading | Wobbled in August, re-accelerated |
| Nifty500 Equal Weight | 111.0 / 82.6 | Weakening | Broad mid/small-cap participation fading |
| Nifty500 Low Volatility 50 | 86.7 / 98.0 | Lagging | Momentum near 100; first defensive factor to watch |
| Nifty500 Multifactor MQVLv 50 | 86.4 / 88.6 | Lagging | No turn yet |
| Nifty500 Value 50 | 85.0 / 89.8 | Lagging | Slowly improving from August lows |
| Nifty500 Quality 50 | 83.9 / 86.4 | Lagging | Swung from weakest to strongest (April) and back |
Step 3: Themes (10 thematic indices)
Themes show which stories the money is chasing. The year moved from a PSU, capex and commodity trade (April) to consumption and new-economy themes (August). On 16 Oct: 4 Leading, 2 Weakening, 1 Improving, 3 Lagging.
| Theme | Strength / Momentum | Quadrant | One-line read |
|---|---|---|---|
| REITs & InvITs | 119.0 / 120.9 | Leading | Highest strength on the map |
| IPO | 116.6 / 120.0 | Leading | Strong, but at a stretched valuation (Step 4) |
| India Digital | 114.0 / 114.1 | Leading | Effectively IT plus Airtel and Eternal |
| EV & New Age Auto | 101.2 / 103.3 | Leading | Just entered; matches Auto turning up |
| Capital Markets | 113.6 / 88.4 | Weakening | Exchanges and AMCs losing pace |
| India Defence | 111.6 / 86.1 | Weakening | Capex and defence complex cooling |
| India Consumption | 86.4 / 104.4 | Improving | Earliest-stage large-cap rotation |
| PSE | 87.8 / 90.9 | Lagging | April leader, now behind |
| Commodities | 84.2 / 89.3 | Lagging | Behind and slowing |
| Rural | 81.3 / 73.0 | Lagging | Weakest momentum on any map |
Step 4: add valuation
The rotation map tells you what is working; valuation tells you how much cushion there is if it stops working. We compared each index's trailing P/E on 16 Oct 2026 with its own historical median, never with other sectors (a bank and a pharma company should not trade on the same P/E).
| Index | P/E now | Own median (window) | vs median | Quadrant |
|---|---|---|---|---|
| Nifty IT | 19.8 | 25.1 (10Y) | −21% | Leading |
| Nifty Bank | 13.2 | 15.9 (5Y) | −17% | Leading |
| Nifty Realty | 35.0 | 49.1 (10Y) | −29% | Leading |
| Nifty Pharma | 39.9 | 35.1 (10Y) | +14% | Leading |
| Nifty Alpha 50 | 27.3 | 30.9 (10Y) | −12% | Leading |
| Nifty IPO | ~100 | 59 (1Y) | +69% | Leading |
| Nifty FMCG | 30.8 | 42.0 (10Y) | −26% | Lagging |
| Nifty India Consumption | 37.7 | 43.5 (full history) | −14% | Improving |
| Nifty India Defence | ~59 | 53 (3Y) | +11% | Weakening |
| Nifty Metal | 15.9 | 15.9 (10Y) | 0% | Weakening |
| Nifty500 Value 50 | 9.7 | 9.9 (7Y) | −2% | Lagging |
| Nifty 500 (benchmark) | 21.9 | 24.2 (3Y) | −10% | — |
Crossing the two answers produces four groups:
- Leading and cheap (the sweet spot): IT, Bank, Alpha 50. Price leadership and valuation support point the same way.
- Leading but rich (fragile): Pharma and IPO. Leadership is real, but there is little cushion if momentum breaks.
- Cheap but lagging (value trap until proven otherwise): FMCG. Wait for it to curl into Improving.
- Fading and rich (avoid): Defence. Momentum is falling and the valuation is still above its own history.

The IPO index's +69% is compressed to fit; Consumption sits in Improving, closest to turning up.
Valuation is a filter, not a timing signal: a cheap sector can stay cheap for a year, as FMCG did.
Step 5: cross-check the maps and open the index
The shortlist came from ideas that survived all three maps, the valuation check and a look inside each index. Single maps mislead; agreement across maps is the signal.
- Start with the hypothesis. The first idea was: buy IT and Bank, add Momentum 50 and Alpha 50, and shift to larger caps because Equal Weight is weakening.
- Check every leg against the other maps. IT was confirmed twice: the sector map (Leading) and the thematic map (India Digital Leading). Bank had sector leadership and a P/B near a five-year low.
- Open the index factsheet. This is where two legs failed:
- Nifty500 Momentum 50 held only 0.48% in IT. Its top weights were capital goods (31%) and financials (24%, mostly exchanges and NBFCs): MCX, BSE, Shriram Finance, Hindalco, GE Vernova T&D.
- Nifty Alpha 50's top weights were small and mid caps: Cupid, Sterlite Tech, MTAR, HFCL, Ather. That contradicts a move to larger caps.
- Check the constituents' themes. Capital Markets (BSE 20%, MCX 19%) and Defence were both Weakening on the thematic map. So the stocks driving Momentum 50 belonged to themes that were rolling over. Momentum 50 rebalances only in June and December, so until then it holds yesterday's winners.
- Check the news flow. The IT move was earnings-led (TCS, HCLTech, Tech Mahindra and Wipro beat in Q2 FY27), not just a bounce. Nifty IT gained 11.7% in the week to 16 Oct, its best week in 18 years, which argues for staggered entry. Axis Bank's Q2 profit rose 38% with loans up 23%; HDFC Bank and ICICI Bank results were due on 17 Oct.
What survived and what was dropped
| Idea | Outcome | Why |
|---|---|---|
| IT (sector or India Digital, not both) | Kept | Leading on two maps, 21% below its 10Y median P/E, earnings-led |
| Large private banks | Kept, pending results | Leading, cheap on P/E and P/B; HDFC/ICICI results decide it |
| Large-cap core (Nifty 50) | Kept | Equal Weight weakening argues for moving up the cap curve |
| Auto / EV & New Age Auto | Watchlist | Improving on the sector map, just Leading on the thematic map |
| India Consumption | Watchlist | Improving and 14% below its long-run P/E |
| Nifty500 Momentum 50 | Deferred to December rebalance | Holdings sit in fading themes; almost no IT |
| Nifty Alpha 50 | Dropped | Small-cap heavy; contradicts the larger-cap tilt |
| Capital-markets stocks (exchanges, AMCs) | Dropped | Theme Weakening despite high momentum-index weights |
| Defence | Dropped | Weakening and still above its own P/E history |
| IPO theme | Dropped | Leading at ~100 P/E, 69% above its median: a froth signal |
The shortlist is a list of things to research further, not a set of trades. Position size, entry and exit rules come next and depend on each person's own situation.
Step 6: connect the maps to the macro backdrop
The October 2026 maps largely agree with what the macro backdrop predicts, and the two places where they disagree (REITs, large banks) are where caution is warranted. Macro gives you a hypothesis about who should win; the map tells you whether money is actually acting on it.
The backdrop in October 2026
- Tightening: the RBI raised the repo rate by 25 bp on 7 Oct, its first hike in nearly four years, and moved to a "calibrated tightening" stance. The Governor said much of the roughly ₹7.3 trillion liquidity surplus should be absorbed this financial year through reverse repos, bond sales and FX intervention (Business Recorder).
- Energy shock: Brent traded around $102–107 in October, with the Indian crude basket near $121. September CPI was 5.54% and the 10-year G-sec yield hit a three-year high (Multibagg).
- Capital outflows: FPIs sold about ₹45,000 crore in the first 12 days of October and about ₹3.6 lakh crore in 2026, with US long-term yields near 5.2%. The rupee traded near 94.8 per dollar (Alice Blue).
What each force usually does, and what the maps showed
| Macro force | Usually helps | Usually hurts | What the 16 Oct maps showed | Agreement |
|---|---|---|---|---|
| Weak rupee | Exporters: IT, pharma | Importers | IT and Pharma Leading | Strong |
| Crude above $100 | Upstream producers | Rural demand, FMCG, paints, chemicals, aviation | Rural (73 momentum), FMCG and Commodities Lagging | Strong |
| Rate hike, liquidity drain | Low-beta, cash-rich large caps | Small caps, leveraged and high-beta names, IPOs | Equal Weight Weakening; Capital Markets Weakening; IPO still Leading | Partial: IPO is the outlier |
| Liquidity drain for banks | Lenders with floating-rate books (faster loan repricing) | Deposit costs, bond-portfolio losses | Bank Leading | Mixed: watch NIMs in Q2 results |
| FPI selling | Domestically owned stocks | Large caps with high foreign ownership | Large banks and IT (high FPI ownership) Leading | Tension: leaders are FPI-heavy |
| Rising bond yields | — | Yield assets: REITs, InvITs | REITs & InvITs Leading | Tension: likely relative defensiveness in a falling market |
How to use the overlay
- Where macro and map agree (IT on the weak rupee, consumption and rural hurt by crude), conviction can be higher.
- Where they disagree (REITs leading while yields rise, the IPO theme leading into a liquidity drain), treat leadership as fragile and watch momentum closely.
- Watch for a regime change. If crude falls back below $90 or the RBI signals the tightening is done, the macro case for Consumption, Rural and FMCG improves. They are already the theme and sectors closest to turning up. A map that starts confirming that shift (momentum crossing 100) is the trigger, not the macro headline alone.
What the tool cannot do
Rotation maps measure relative performance. They help you rank and time; they do not forecast prices.
- Relative is not absolute. Nifty 500 fell about 7.5% in the September quarter, so a Leading index can still lose money. Stops belong on price, not on a quadrant change.
- Clockwise is a tendency, not a rule. Metal moved from Lagging back to Weakening this year; indices can hook back without completing the cycle.
- Indices hide their contents. Momentum 50 looked like an IT and Bank companion until the factsheet showed 0.48% IT. Always open the factsheet.
- Rebalance lag. Factor indices rebalance twice a year, so they can hold names from fading themes for months.
- Valuation histories are short for new indices. Most factor and thematic P/E series start in 2024–25, so their medians are rough.
- Event risk sits outside the map. Results, policy meetings and oil shocks can move an index across a quadrant in a week.
A simple discipline: act only when at least two maps agree, check the factsheet, size small where valuation is rich, and review weekly.
Sources
Rotation data: Kevala Market Compass weekly runs (sectoral, strategy and thematic presets), 5 Dec 2025 to 16 Oct 2026.
- Valuations: indexpe – Nifty IT, Nifty Bank, Nifty Pharma, Nifty Realty, Nifty FMCG, Nifty Metal, Nifty Alpha 50, Nifty500 Value 50, Nifty IPO, Nifty India Defence, Nifty India Consumption, Craytheon – NSE Sector PE
- Index constituents: NSE – Nifty500 Momentum 50 factsheet, NSE – Nifty Alpha 50 factsheet, NSE – Nifty 500 factsheet, indexpe – Nifty Capital Markets, indexpe – Nifty India Digital
- Earnings and news: HDFC Sky – IT leads rally, 16 Oct 2026, Business Standard – Axis Bank Q2 FY27
- Macro: Business Recorder – RBI on liquidity, Multibagg – crude above $100, Alice Blue – FII selling in October
Disclaimer
This case study is for educational purposes only. It is not investment advice or a recommendation to buy, sell or hold any security, index, sector or fund. Indices and stocks are named only to illustrate the method. Data is as of 16 Oct 2026 and may change; past relative performance does not indicate future results. Investments in the securities market are subject to market risks. Read all related documents carefully before investing. Registration granted by SEBI, membership of BASL and certification from NISM in no way guarantee performance of the intermediary or provide any assurance of returns to investors. Gunjal Jayadrath Suresh (Kevala Capital), SEBI Registered Investment Adviser, Reg. No. INA000020420, BASL Membership ID 2309.